Interval charts answer where a span begins and ends. The endpoints may represent time, uncertainty, a daily trading range, or a percentile envelope. Model those meanings explicitly with x1 and x2 or y1 and y2; do not force intervals through a point-value channel.
| Reader question | Start with |
|---|---|
| How did each trading day move from open to close? | Horizontal price interval |
| Which tasks block which, and how far along is each phase? | Gantt lanes with dependency arrows |
| How uncertain is each point estimate? | Point plus low-high error bar |
| What were open, high, low, and close for each period? | Candlestick |
| How does a percentile range evolve over time? | Quantile ribbon plus median line |
| How do explicit lower and upper measurements change together? | Range area in Lines and Areas |
The definition may receive endpoint fields directly or derive them from typed reducer outputs. In either form, endpoint units must match the scale. Data and Channels defines these interval channel shapes.
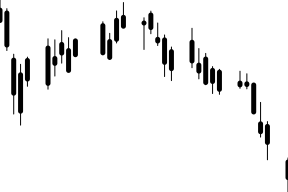
This view maps each AAPL trading date to a categorical lane and its Open and Close fields to a horizontal rectangle. Color distinguishes gains from losses, while the endpoints carry the price movement directly.
Keep trading dates stable and lane order explicit. Date labels rely on automatic guide measurement; verify them at the smallest supported width with Responsive Charts.
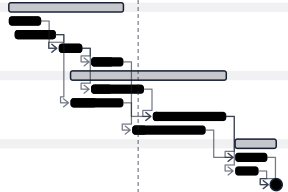
A Gantt chart puts each task on its own lane and its start and end on a time axis. This plan groups ten tasks under three phase header lanes, fills each task's completed share, marks the go-live milestone, and draws the status date as a dashed rule.
Derive the lane order, phase roll-ups, progress spans, and dependency endpoints in an ordinary module before the definition. Lanes are a scaleBand domain, so a phase lane and its task lanes keep their order; the y-axis tickLabels options indent task labels and bold the phase labels.
Each finish-to-start dependency is a link from the predecessor's end to the successor's start. The link's curve receives the two resolved pixel points, so a small d3 curve factory passed through d3Curve draws right-angle segments and an arrowhead. It leaves the predecessor's right edge and enters the successor's left edge. When the successor starts too soon for a direct step, the connector runs back through the lane gutter first.
Wrap connectors, progress fills, and the status rule in decorative so keyboard focus stops only on phases, tasks, and the milestone. Arrow keys step left to right by default; a focus strategy that spreads focusNearestY and sorts navigation by y, then x, walks the lane tree from top to bottom. Name each task's predecessors in its tooltip text, because the connectors themselves are not focusable.
An error bar combines a point estimate, a low-high link, and endpoint ticks. The chart renders the supplied interval; it does not decide whether the bounds are standard deviation, standard error, a confidence interval, or a credible interval.
import { defineChart, dot, link, tickY } from '@tanstack/charts'
import { scaleBand } from '@tanstack/charts/scales/band'
import { scaleLinear } from '@tanstack/charts/scales/linear'
import { estimates } from './data'

export default defineChart({
  marks: [
    link(estimates, {
      x1: 'treatment',
      y1: 'low',
      x2: 'treatment',
      y2: 'high',
      stroke: '#2563eb',
      strokeWidth: 1.5,
    }),
    tickY(estimates, {
      x: 'treatment',
      y: 'low',
      stroke: '#2563eb',
      strokeWidth: 1.5,
    }),
    tickY(estimates, {
      x: 'treatment',
      y: 'high',
      stroke: '#2563eb',
      strokeWidth: 1.5,
    }),
    dot(estimates, {
      x: 'treatment',
      y: 'estimate',
      key: 'treatment',
      fill: '#2563eb',
      r: 4,
    }),
  ],
  scales: {
    x: { scale: () => scaleBand<string>().padding(0.3) },
    y: {
      scale: scaleLinear,
      grid: true,
      axis: { label: 'Mean response (95% confidence interval)' },
    },
  },
})export const estimates = [
{ treatment: 'Control', estimate: 42, low: 36, high: 48 },
{ treatment: 'Low dose', estimate: 51, low: 45, high: 57 },
{ treatment: 'High dose', estimate: 63, low: 56, high: 70 },
]Name the interval in the chart description or surrounding prose. Compose the link, caps, and point as separate layers using the Rules, Links, Arrows, Vectors, and Ticks reference and Dot and Hexagon Marks.
The full catalog example starts with contributing observations, groups them once with groupBy, and derives the interval from typed mean and sample-deviation outputs. The estimator and singleton policy remain authored chart meaning; no dedicated error-bar mark is required.
A candlestick uses a high-low wick and an open-close body. Directional color is secondary to the body endpoints and should not be the only way to distinguish an increasing period from a decreasing one.
Use one row per period with all four values. Render the wick as a link and the body as a ranged rectangle; preserve missing trading periods on the temporal domain instead of silently inventing observations.
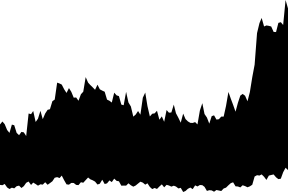
A quantile ribbon combines a prepared lower percentile, median, and upper percentile for each time group. It shows how both location and spread evolve.
Use groupBy with quantile reducers to preserve each time group's source rows, then give the ribbon and median their own marks. Transforms and Reactivity defines the aggregation boundary; Line and Area Marks defines the range-area channels.
Rectangle channel details are in Bar and Rect Marks.